Could 2026 bode well for US small-caps?


Written by Aniket Ghatak, Assistant Portfolio Manager, Alvarium Wealth.
Please note all numbers stated are in US dollar terms. Past performance does not guarantee future performance.
By definition, a ‘small-cap’ stock is one which represents a publicly traded company that has a relatively small market capitalisation, anywhere between $250 million to $2 billion USD.
This compares to those that you’d find listed on an index like the FTSE 100 or the S&P 500, which are classified as ‘large-caps’, thanks to market capitalisations in excess of $10 billion USD.
The appeal of small-caps typically lies in the fact that the underlying companies offer stronger growth potential relative to larger, more established firms. However, they bring their own risks, including more volatility.
The global small-cap equity universe consists of a much larger and broader opportunity set than that offered by its mid-cap and large-cap counterparts. Today, global small-cap stocks represent 85% of the publicly investible market (by number of companies), of which 65% of the index is dominated by the US constituents (based on the FTSE Global Small Cap Index)[1]. And yet, for every one analyst that covers a small-cap company there are approximately four analysts covering a single large-cap firm[2].
At the time of writing, this relatively unloved and underappreciated section of the investment universe is trading at a relative discount to large-cap peers.
Could 2026 be the year when investors start to take more interest?
Go small or go large?
In 1993,research by Fama and French that led to the so-called ‘three-factor model’ concept[3], discovered that small-caps are likely to outperform large-caps over the long term, providing the end investor with what was termed as a “size premium”.
Since then, performance by small-caps has been relatively inconsistent. However, what has been consistent is the sensitivity of small-caps’ performance to interest rates and economic cycles.
Historical trends, while no guarantee of future performance, show that relaxed monetary policy – in other words, lower interest rates – typically create a tailwind for small-caps. This is because lower rates ease their debt burdens and decrease the cost of capital.
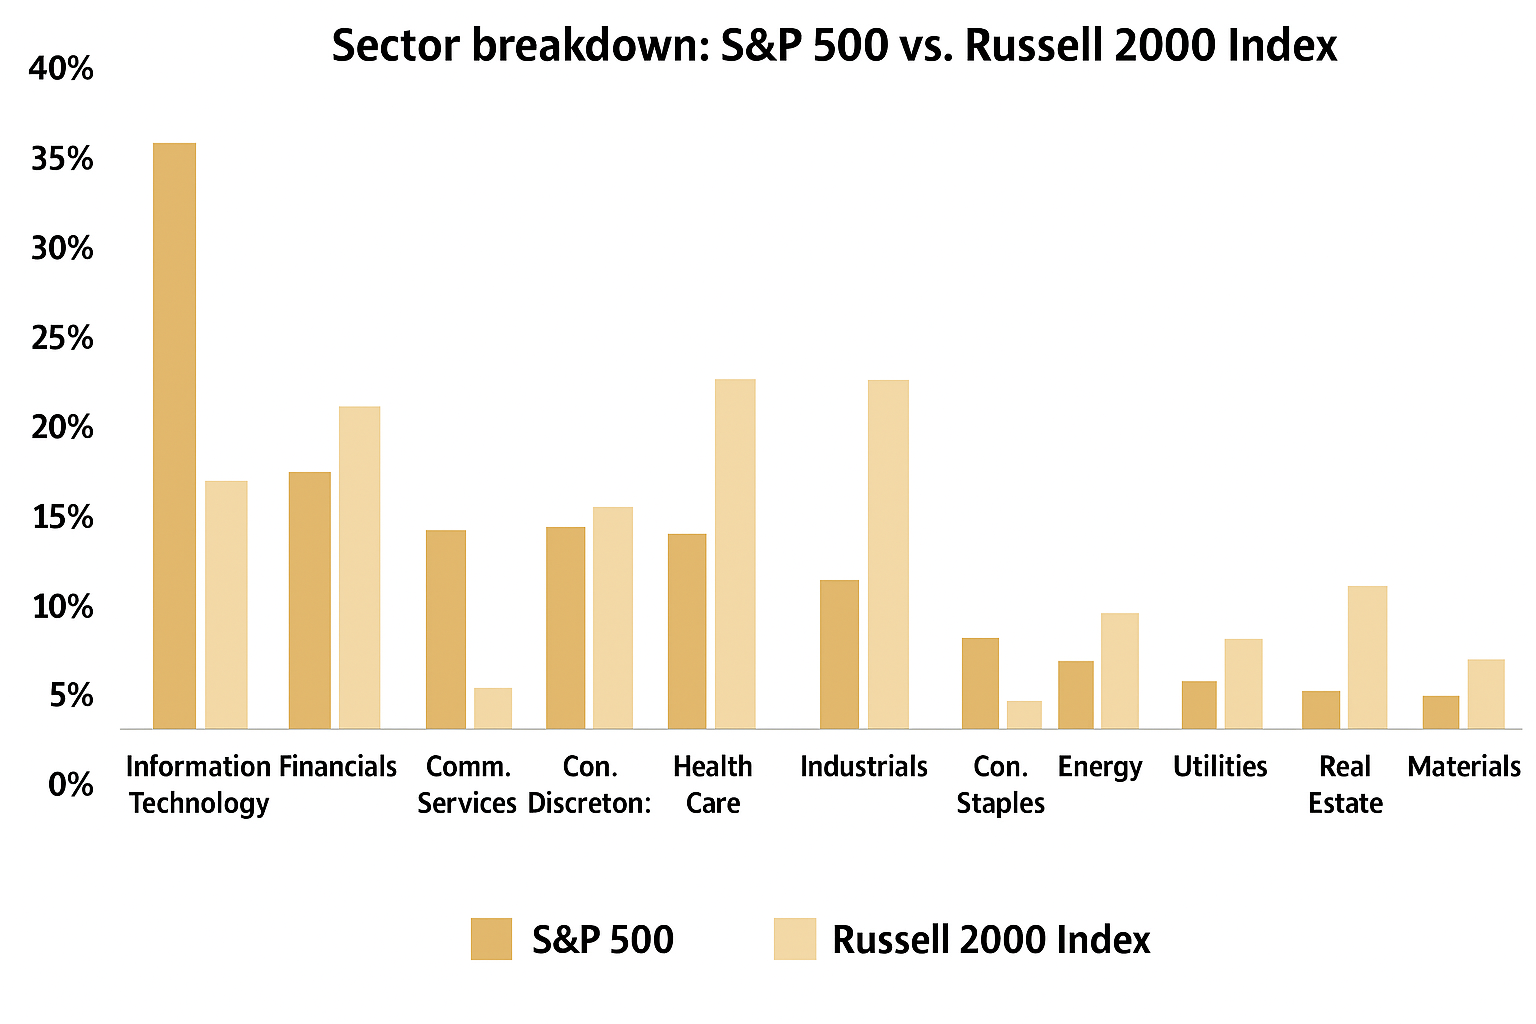
In the Russell 2000 index - a small-cap US stock market index - 41% of the companies listed rely on floating or variable rate debt. In comparison, only 19% of those mega-caps in the S&P 500 index have similar facilities in place[4].
Since 1990,US small-caps have outperformed large-caps on average in the one, three, six, twelve, and twenty-four months after the US Federal Reserve (Fed) has cut rates[5].
On the back of two recent Fed rate cuts, and in anticipation of the third cut of the year that was eventually announced on 10 December 2025, the Russell 2000 has outperformed the S&P 500 by 5% in the last 6 months. It hit a near-record monthly high of 7.1% in August 2025, which represents the strongest monthly performance against the S&P 500 in the last 12 months[6].
Small-caps have also outperformed in times of economic recovery, particularly after a period of recession. In the US, small-cap valuations provide a close approximation of the general consumer sentiment of the country, given that the majority of small-cap revenue comes from its domestic markets.
This is also a reason why performance of small-cap stocks is often seen as a barometer for the future of the economy.
Following the fallout of the Global Financial Crisis in 2008, US small-caps outperformed large-cap stocks over the following three years[7]. In September 2025, Bank of America’s Global Research team moved its US Regime Indicator from a “downturn” to a “recovery”[8]. Analysts interpreted this as a sign that less popular stocks, for example small-caps, may be about to tick up.
Valuation context
Looking ahead to trading conditions in 2026, it would appear that small-caps score favourably on the valuation front.
When held up against their large-cap counterparts, we can see that they have been trading at a discount for quite some time.
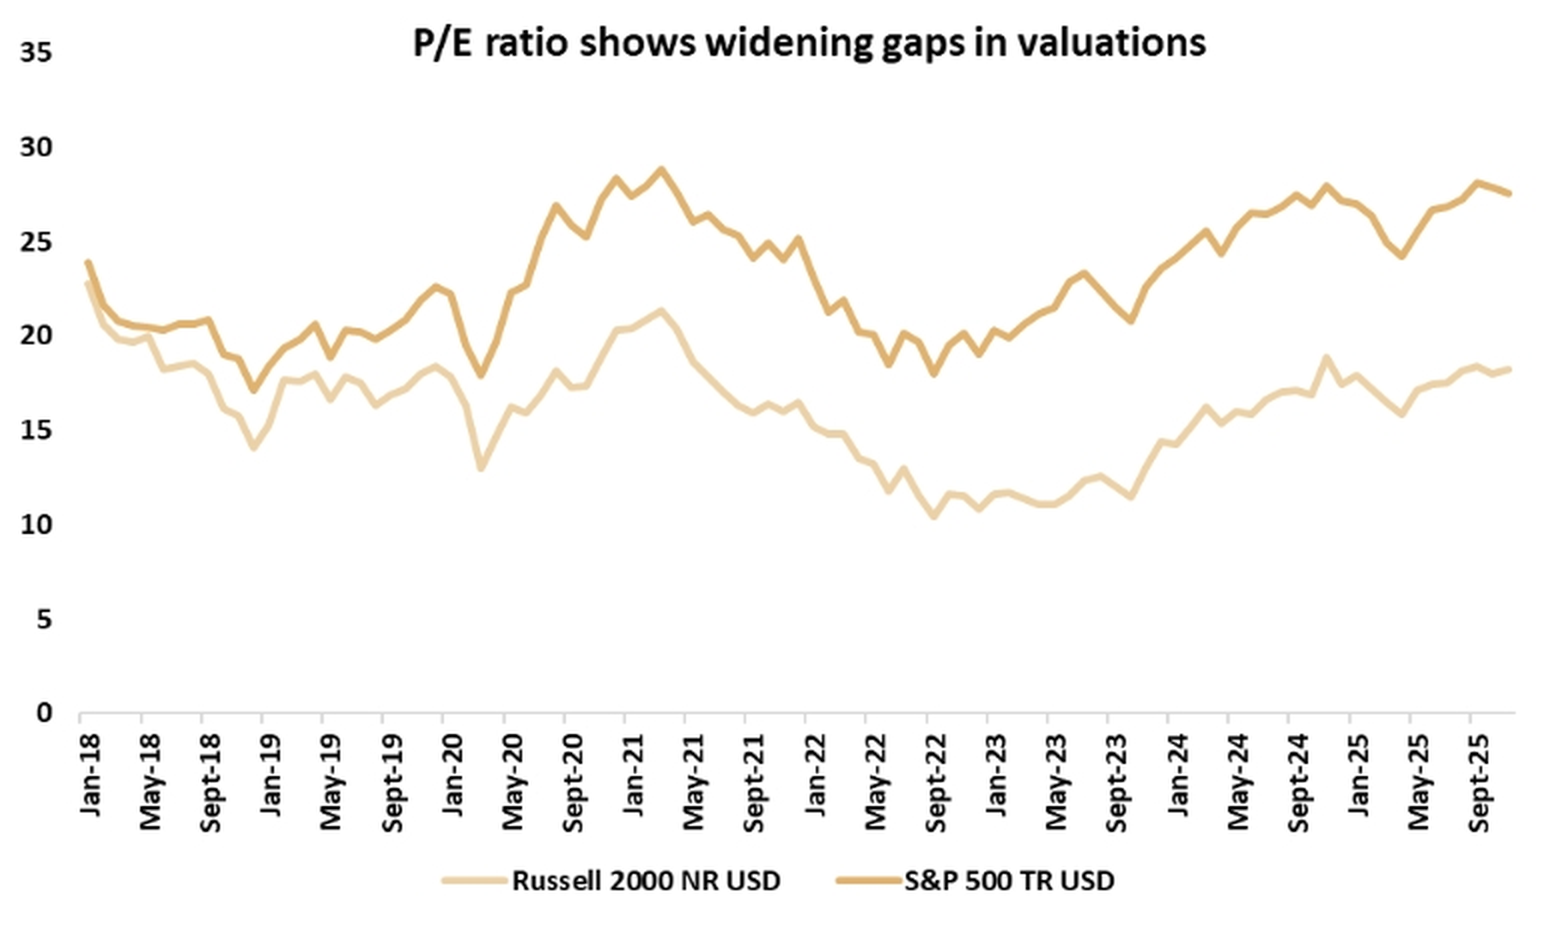
Using a 12-month forward price-to-earnings (P/E) multiple – which is one of the valuation measures for deducing share price compared to price-per-share - we see that the US small-cap cohort currently hovers around 19x, whereas US large-cap multiples are sitting at 23x.
In other words, based on that metric alone, investors are willing to pay $19 for every $1 of a listed US small-cap company’s annual earnings. Conversely for listed US large-caps, investors are prepared to pay $23 dollars for every $1 of a company’s annual earnings[9].
At the time of writing, a few of the listed US small-cap companies have started to revise their forward earnings upward, which means that that ratio is likely to look more attractive at current prices. This also bodes well for M&A activity in the sector, as acquisitions in the Russell 3000 index are currently on pace to hit a record high last set in 1996[10].
What could this mean for small-caps in 2026?
Based on current valuations and given the historical trends that have typically provided a tailwind for small-caps, the investment case for increasing exposure to small-caps would appear to have strengthened in recent months.
Resilient economic activity in the US, a December rate cut by the Fed, an upward revised earnings outlook and an increase in M&A activity, could prove to be catalytic.
However, it’s important not to view small-caps in isolation and wider portfolio dynamics should always be considered when weighing up whether or not to invest. If we were to see a downturn in the US economic data, a hawkish tone from the Fed, and/or an increase in global uncertainty, then the investment case for allocating more to small-caps would diminish.
Based on current conditions, the outlook for US small-caps looks promising. By targeting high-quality businesses at reasonable valuations, portfolio managers and fund managers may be able to boost returns and build in a useful degree of diversification versus mega-caps.
[1]Source: https://research.ftserussell.com/Analytics/FactSheets/Home/DownloadSingleIssue?issueName=GEISSC&isManual=False
[2]Source: https://www.artisanpartners.com/content/dam/documents/insights/vxus/International-Small-Caps-A-Strategic-Asset-Class-vXUS.pdf
[3]Source: https://www.ifa.com/articles/celebrating_groundbreaking_research_with_giants_finance_fama_french
[4]Sources:
Https://www.aberdeeninvestments.com/en-gb/intermediary/insights-and-research/a-us-small-caps-rebirth, and, https://www.ml.com/articles/small-cap-stocks-outlook.html
[5]Source: https://www.ml.com/articles/small-cap-stocks-outlook.html
[6]Source: https://www.privatebank.bankofamerica.com/articles/small-cap-stocks-outlook.html
[7]Source: Morningstar data
[8]Source: https://www.msn.com/en-us/money/markets/bank-of-america-flags-3-signs-that-the-stock-market-may-be-heading-for-a-decline/ar-AA1MDZ0k#:~:text=Historically%2C%20the%20last%2010%20days,LendingTree
[9]Source: https://am.jpmorgan.com/be/en/asset-management/institutional/insights/market-insights/market-updates/on-the-minds-of-investors/small-cap-valuations-explained/
[10]Source: https://www.investing.com/news/stock-market-news/here-are-the-5-bullish-themes-for-small-caps-in-the-year-ahead-according-to-bofa-4385551
Photo credit: Jon Tyson for Unsplash
